Shekela Best

Teacher ➡️ Data analyst
Taking complexity and transform it into beautiful simplicity
View My LinkedIn Profile
Building a Solid Foundation: Massachusetts Education
Imagine being told that you have won a magnificent mansion nestled in the heart of beautiful Hawaii. This luxurious abode is adorned with all the lavish amenities you could ever desire.
Right now, you may be envisioning yourself lounging by the beach, sipping a refreshing piña colada…

But hold on because the best part is yet to come! Brace yourself: the house is situated right on the beach!
Yes, you read that correctly – the house is built directly on the sandy shore. You and your home can seamlessly blend into the tranquil sands…
Although, perhaps now you’re not as thrilled about it. You see, everyone knows that a sturdy foundation is crucial for anything of value to endure. Education follows the same principle.
U.S. Senator Elizabeth Warren of Massachusetts wholeheartedly agrees with this sentiment, noting that:
“A good education is the foundation for a better future.”
Therefore, it came as no surprise when the Secretary of Education expressed a desire to harness the power of data to find answers to a few crucial questions.
Let’s dive into the key questions that fuel our quest for knowledge:
- Elementary schools: What are the top math schools in the states? Specifically grade 4 math.
- High schools: What schools are struggling the most?
- Colleges: How does high school class size affect college attendance percentage?
A simple dashboard with the finding for the school board to show the state of the school system.
My job as a data analyst is to leverage Tableau’s capabilities to visualize and present the answers we seek.
Although we understand that education is influenced by many factors, data provides a starting point for making positive changes. The findings confirmed this idea.
Key Findings:
- An astonishing 75% of elementary school districts excel in the MCAS (Massachusetts Comprehensive Assessment System) 4th Grade Math exam, surpassing the desired 50% threshold.
- The bottom ten high schools had a graduation rate below 20%, which is concerning. It’s important to take immediate action and implement strategies to improve this situation.
- While there seems to be a connection between class size and college admission, the R-squared score of 19% indicates that the relationship is not very strong. This means we need to investigate further to better understand how these two factors are related.
The data used in this analysis is sourced directly from the Massachusetts Department of Education’s official website for the year 2017. (If you’re curious, you can access the data here
Nurturing the Foundation: The Crucial Role of 4th Grade Math in Building Educational Success
The Secretary of Education firmly believes that 4th grade math serves as the cornerstone of a solid foundation for students’ future success.
As a result, there is a dedicated focus on improving students’ performance in the MCAS (Massachusetts Comprehensive Assessment System) 4th Grade Math exam.
To identify the districts that surpass the desired threshold of 50%, the Secretary intends to compile a list of these districts.
The purpose is to extend invitations to teachers from these districts, who have demonstrated exceptional math score improvements, to train educators throughout the state.
By sharing their successful strategies, these teachers can empower others to enhance math education and raise scores across the board.
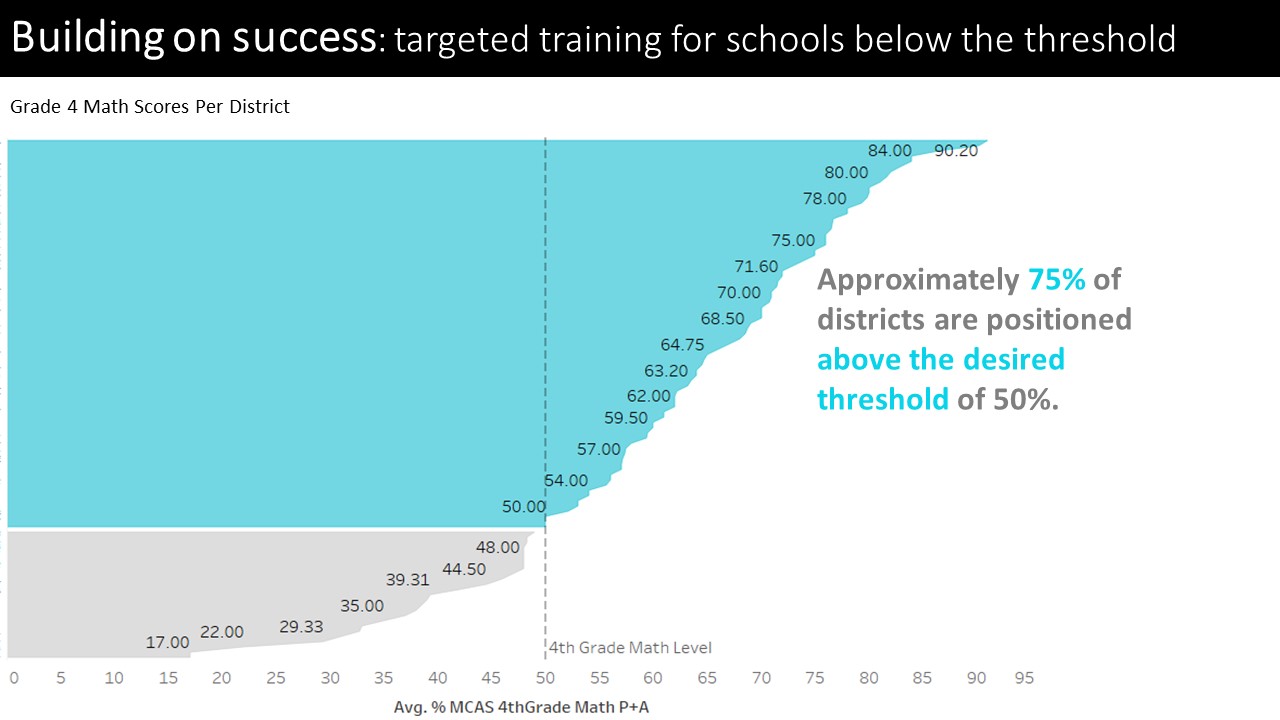
We have generated a line graph to depict the districts that surpass the desired threshold of 50%.
Upon conducting further investigation and graphing the data, we observe that the majority of districts lie above this threshold, about 75%. Notably, districts like Hingham and Winchester stand out, boasting math scores exceeding 90%.
In Dire Need: Unsolid Foundation - Struggling Schools
A high school diploma sets the minimum benchmark for individuals entering the real world, providing a crucial foundation for their journey ahead.
Recognizing the importance of this milestone, the Secretary of Education was determined to identify the bottom 10 high schools with the lowest graduation rates.
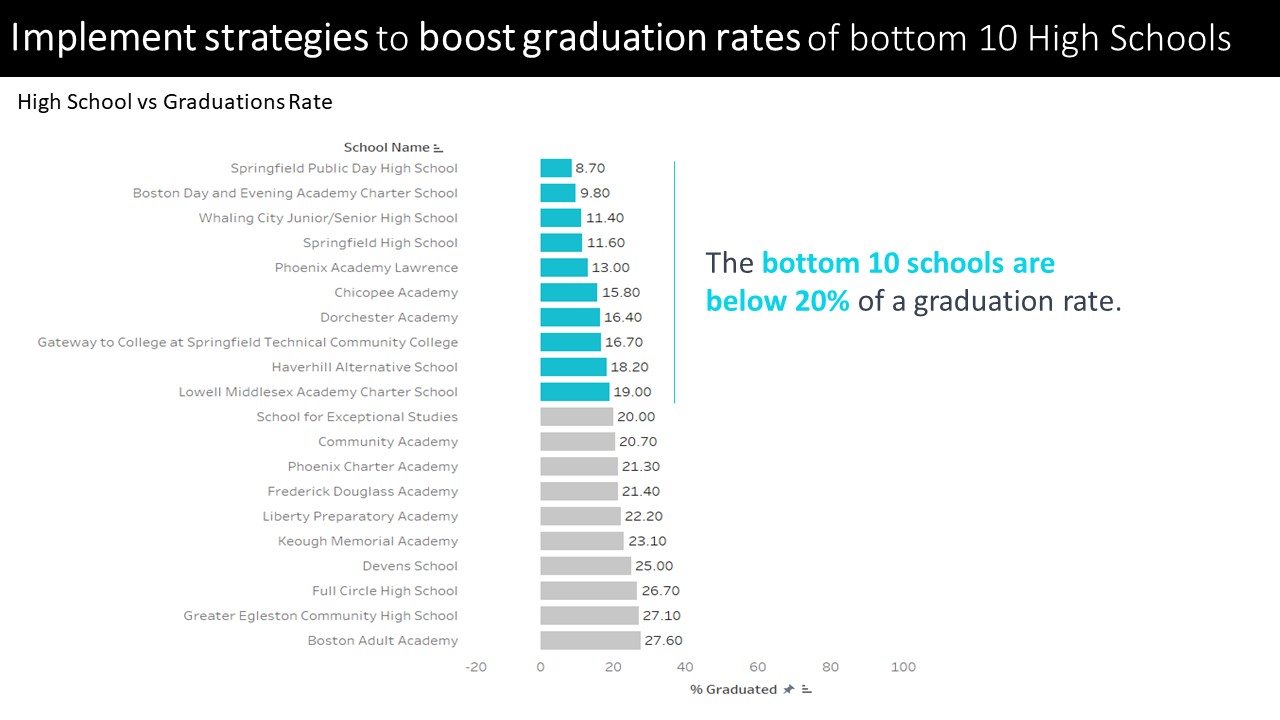
The disheartening reality emerges as the bottom ten schools reveal a graduation rate that falls below the critical threshold of 20%. It is essential to take immediate action to support these schools and address the challenges they face.
The Blueprint: Understanding How Class Size Shapes College Attendance
The Secretary of Education is also exploring strategies to increase college attendance and is considering the possibility of constructing more schools to reduce average class sizes, aiming to boost the percentage of students attending college.
Based on the available data, let’s analyze whether recommending the construction of more schools for this purpose would be advisable.
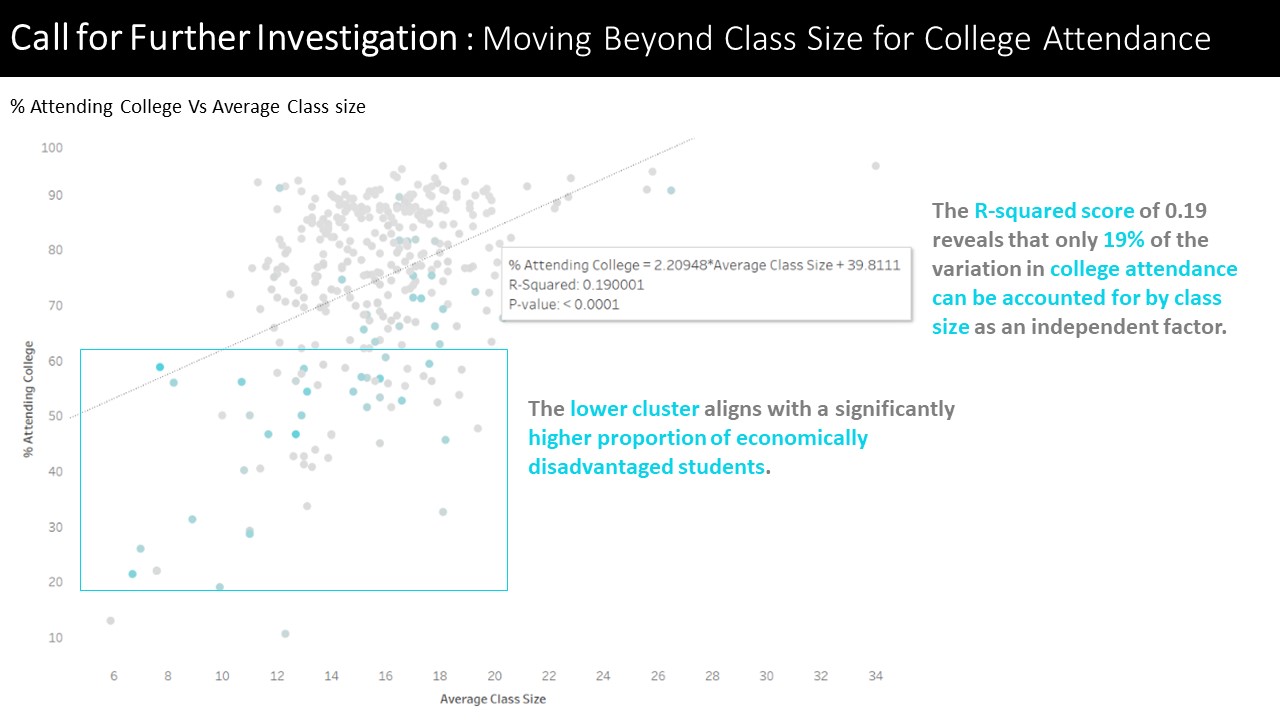
The scatter plot reveals a clear pattern: as class size increases, there is a corresponding rise in college attendance percentage.
Notably, economically disadvantaged students tend to be concentrated in the lower cluster of data points.
However, it’s crucial to note that the weak relationship between class size and college attendance, indicated by an R-squared score of 0.19, suggests that class size alone explains only 19% of the variability in attendance.
The remaining 81% is influenced by unaccounted factors. Therefore, caution is advised in advocating for new schools solely to reduce class size. A more comprehensive investigation is needed to identify and address additional factors that significantly impact college attendance rates.
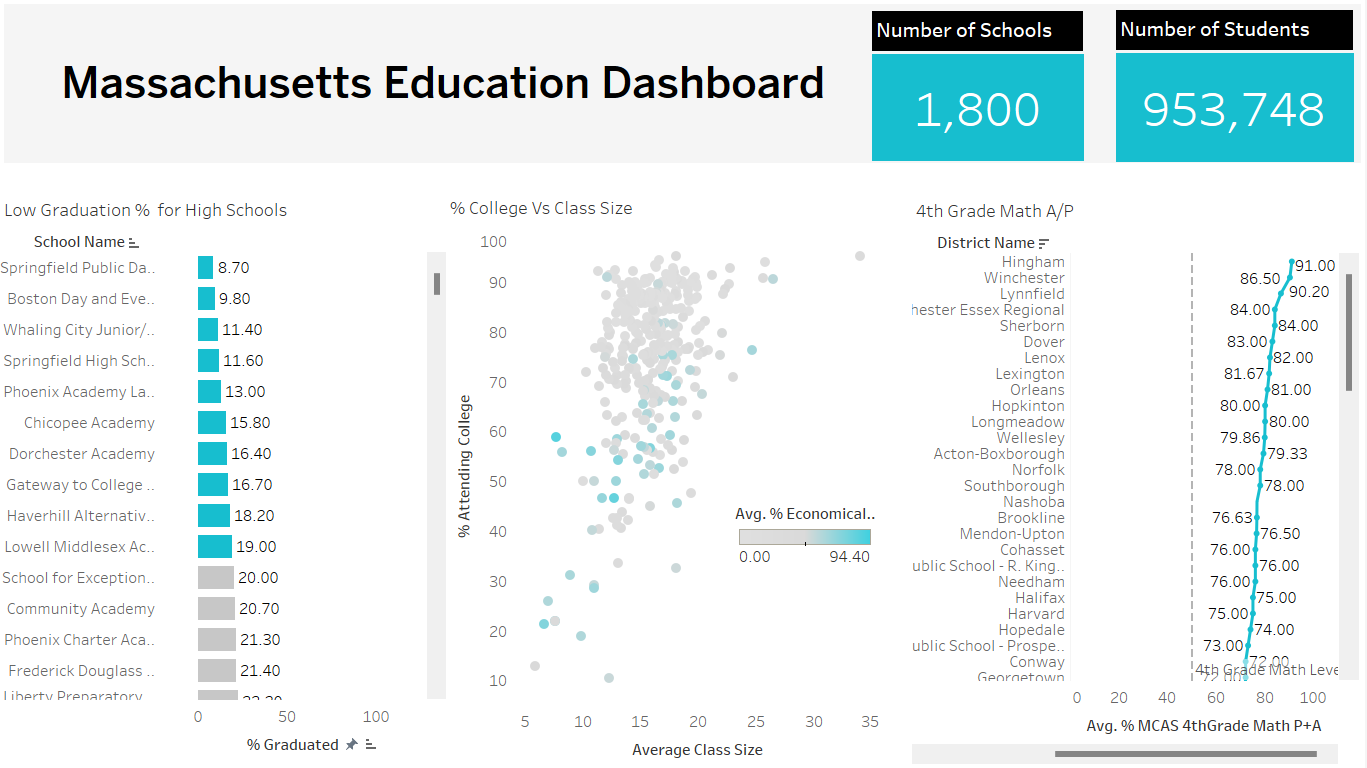
The Dashboard
Lastly, we have merged all the insightful graphs to craft a user-friendly dashboard specifically designed for the Secretary of Education. This simplified dashboard encapsulates the findings, providing a comprehensive overview of the state of the school system for the school board.
Feel free to explore and interact with the dashboard here.
Recap of Key Findings:
- Exceptional Performance in 4th Grade Math: A remarkable 75% of elementary school districts have surpassed the desired 50% threshold in the MCAS 4th Grade Math exam, demonstrating commendable achievement in this critical subject.
- Urgent Intervention Required: Alarmingly, the bottom ten high schools exhibited a graduation rate below 20%, necessitating immediate action and the implementation of effective strategies to improve these outcomes.
- Exploring Class Size and College Admission: While there appears to be some connection between class size and college admission, the R-squared score of 19% indicates that the relationship is relatively weak. This highlights the need for further investigation to gain a deeper understanding of how these factors interrelate.
Thanks for reading!
I’m always on the lookout for data analyst opportunities. Know of any? Don’t hesitate to reach out at smitchellbest@gmail.com. Make sure to explore more of my portfolio. Just click the button below.