Shekela Best

Teacher ➡️ Data analyst
Taking complexity and transform it into beautiful simplicity
View My LinkedIn Profile
Who’s Dining with DoorDash?
Exploring the Demographics of DoorDash Users
One of the greatest innovations of the 21st century undoubtedly lies in the realm of food delivery services, with DoorDash leading the way.
It’s deliciousness at your fingertips, ready to be devoured. Need lunch or dinner? Dash that. Feeling for a sweet treat? Dash that. A snack, anyone? Dash that too! It’s the food genie we’ve always wanted. Convenience at its finest.
As a data-driven individual, I can’t help but wonder who else shares this profound appreciation for DoorDash.
Who are their main demographics? And if I were a marketing analyst working for DoorDash, what would their clientele look like? Moreover, what recommendations can I provide to further enhance their success and customer satisfaction?
Dashing through Data
Just like any diligent data analyst, I obtained an online DoorDash dataset for analysis. (If you’re curious, you can access the dataset through this link.)
The DoorDash dataset I worked with consists of 2205 rows and 36 columns. By delving into this dataset using Excel, I have uncovered numerous fascinating and unexpected insights:
- 65% of DoorDash customers are in committed relationships.
- The more children customers have, the less likely they are to be DoorDash customers.
- Middle-aged adults are the highest group that orders DoorDash.
- Lastly, there is a correlation between income and how much you spend on DoorDash. The more money you make, the more money you’ll spend on their services.
Although the dataset provided a wealth of information, my primary focus centered around the demographic attributes of customers.
The dataset spans the years 2014 to 2016, allowing for an analysis of how demographic attributes, such as income, age, relationship status, and the number of children/teenagers, may have evolved during that timeframe.
Analyzing the Dash: Uncovering DoorDash’s Demographic Dynamics
Love and Orders: Are DoorDash Customers Booed Up?
Let us begin our analysis by exploring into the current relationship statuses of DoorDash customers.
I wasn’t sure where the demographic breakdown would lie for relationship status since Doordash seems tailored for the masses. Because who doesn’t like to eat, right?
Or so I thought… The data revealed a different story.
Shockingly, 65% of the customers were “booed” up; this includes individuals who are married as well as those who are in domestic partnerships or cohabiting with a partner without the legal marriage status.
With the majority of customers being in relationships, this clientele should be a target for advertising and promotional campaigns.
Offering couple deals and transforming date nights into “Dash that” nights for a romantic and convenient dining experience.
This intriguing insight sparked my curiosity, leading me to further explore the data to determine whether it was exclusively couples or if children were also a factor.
Certainly! Here’s the provided content formatted in Markdown:
Now, Is It a Family Feast?
My initial hypothesis was that, of course, families are always on a “dash”! Picking up the kids from soccer, what about dance rehearsal? School? Don’t forget that doctor’s appointment! Why wouldn’t DoorDash be a great option?
However, the data revealed the opposite:
According to the data, the more dependent children you have, the less likely you are to be a DoorDash customer. This was shocking at first, but then I thought about it—more kids, more meals needed, and more expensive the order.
There’s always room for improvement! Putting more emphasis on families can be a game-changer. After all, more family meals mean more revenue for the company.
- Offer Family-Friendly Discounts and Specials! Providing affordable options and incentives for busy parents who need meal solutions without breaks. Make DoorDash the go-to answer for families’ mealtime challenges.
Age is just a number, but does it shape our clientele?
Now that we have discovered that couples make up the majority of our customer base, with fewer customers having children living at home, let’s explore the age dynamics.
Are we serving a youthful crowd, adults in their prime, or perhaps more seasoned individuals, even elders?
Each demographic has its rightful place, and each one needs to eat.
Let’s dive into the observations we have acquired from the data:
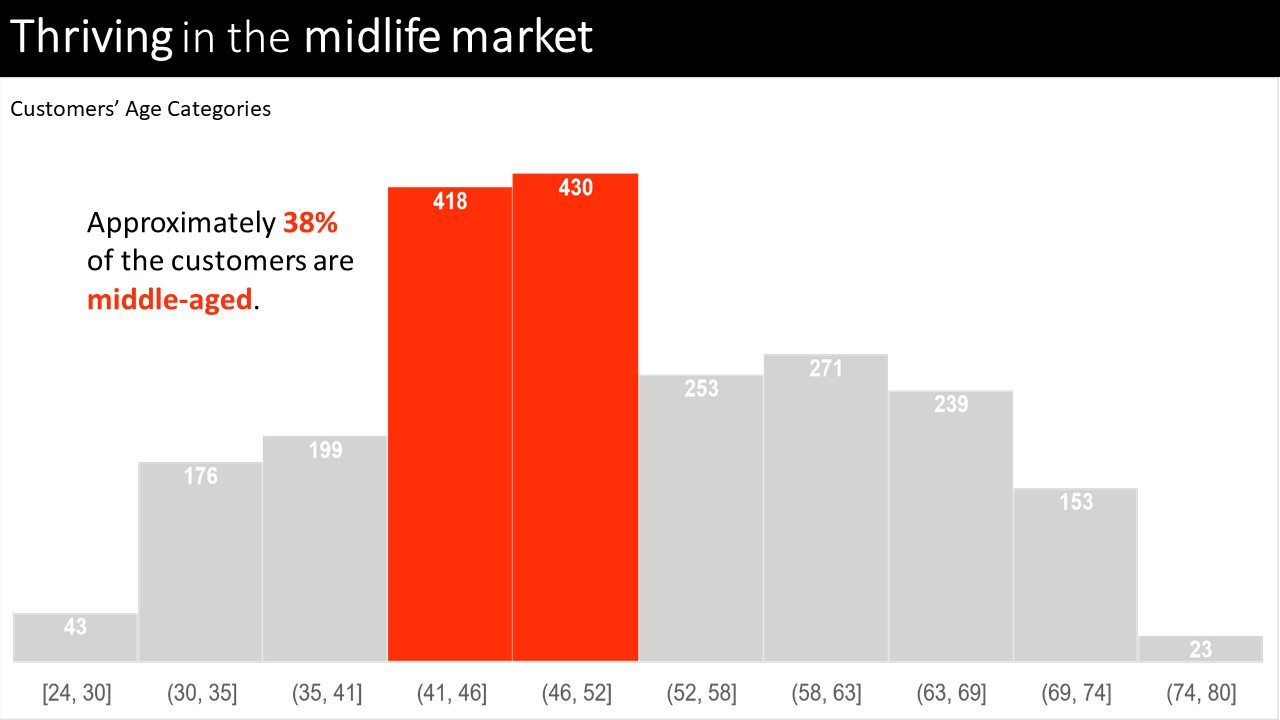
The data reveals that the midlife clientele is thriving, making up 38% of DoorDash customers. This is an interesting finding that makes sense. Yet, it is fairly normal to have relationship stability and fewer kids at home around that age.
DoorDash should continue to focus on the midlife market by implementing targeted marketing strategies that cater to their specific needs and preferences.
- This can be achieved through initiatives such as offering personalized promotions, providing convenient meal options tailored for busy professionals, and highlighting the health benefits of nutritious meals for individuals in this age group.
Speaking the Language of Money: Who’s Buying the Food?
Now, let’s compare the financial aspect of our clientele.
Given that our customers are in committed relationships, have fewer children, and fall into the middle-age category, it is evident that they likely have higher incomes. This assumption is based on the fact that individuals in this age group are typically more established in their careers and have the potential for greater financial stability.
But let’s look into the data to validate this assumption:
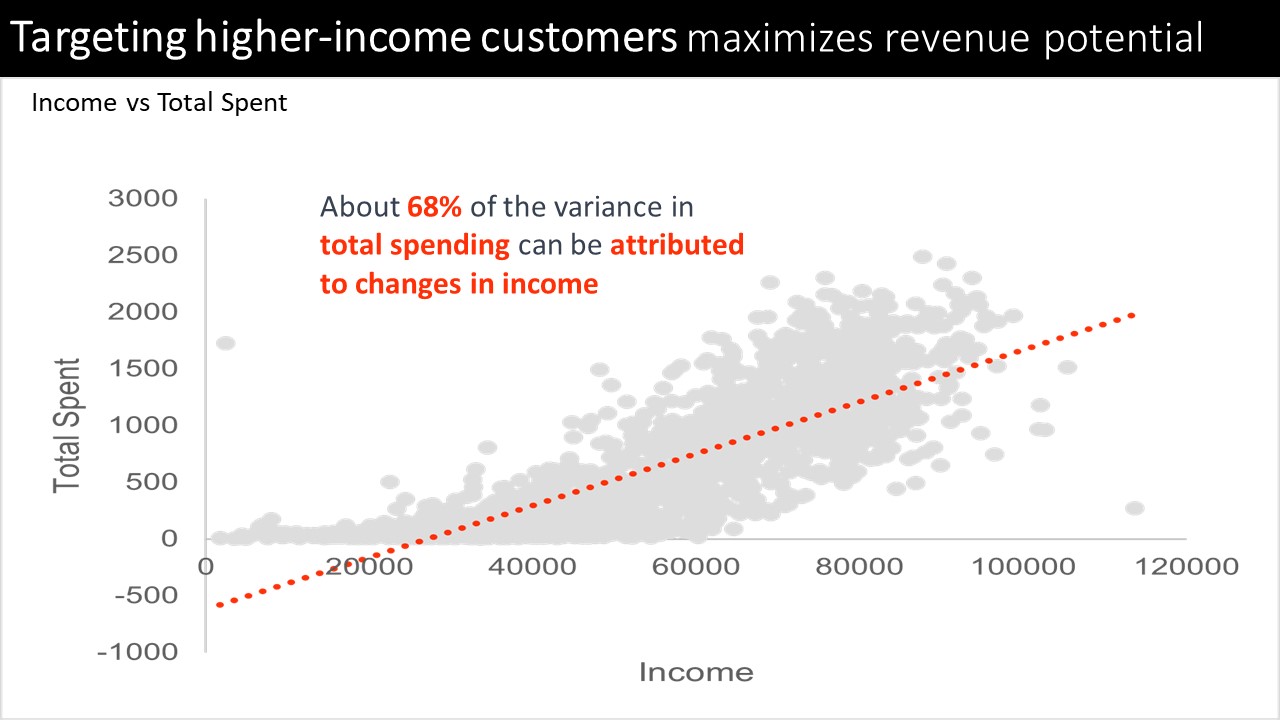
There is a positive correlation between income and total spent, as indicated by the r-squared score of 0.68. This means that approximately 68% of the variation in “Total Spent” can be explained by changes in income.
As a marketing team, it is evident that targeting higher-income customers can be advantageous, as they are more likely to spend more on our services.
Dash Recap: Unveiling DoorDash’s Demographic Insights
Key Insights:
- Relationship Status: With 65% of customers “booed” up, DoorDash is the go-to dining option for couples in committed relationships.
- Children: When it comes to feeding a family, the data reveals that customers with more dependent children are less likely to be Dash enthusiasts.
- Age: The midlife dashers, comprising 38% of our clientele, show a strong appetite for DoorDash’s convenient dining solutions.
- Income: Money talks in the world of food, and our data confirms a positive correlation between income and total spent on DoorDash.
Dash-tastic Recommendations:
- Relationship Status: Whip up couple deals and promotions to make DoorDash the ultimate destination for romantic “Dash that” nights.
- Children: Serve up family-friendly feasts and irresistible incentives to make DoorDash the mealtime hero for busy parents.
- Age: Cater to the cravings of our midlife dashers with tailored marketing strategies that speak to their needs and preferences.
- Income: Turn up the flavor by showcasing DoorDash as the gourmet choice for higher-income customers who value convenience and quality.
With these Dash-tastic recommendations, DoorDash is poised to satisfy cravings, capture hearts, and dash ahead in the food delivery industry.
Thanks for reading!
I’m always on the lookout for data analyst opportunities. Know of any? Don’t hesitate to reach out at smitchellbest@gmail.com. Make sure to explore more of my portfolio. Just click the button below.