Shekela Best

Teacher ➡️ Data analyst
Taking complexity and transform it into beautiful simplicity
View My LinkedIn Profile
Welcome to My Portfolio
Learn About My Projects
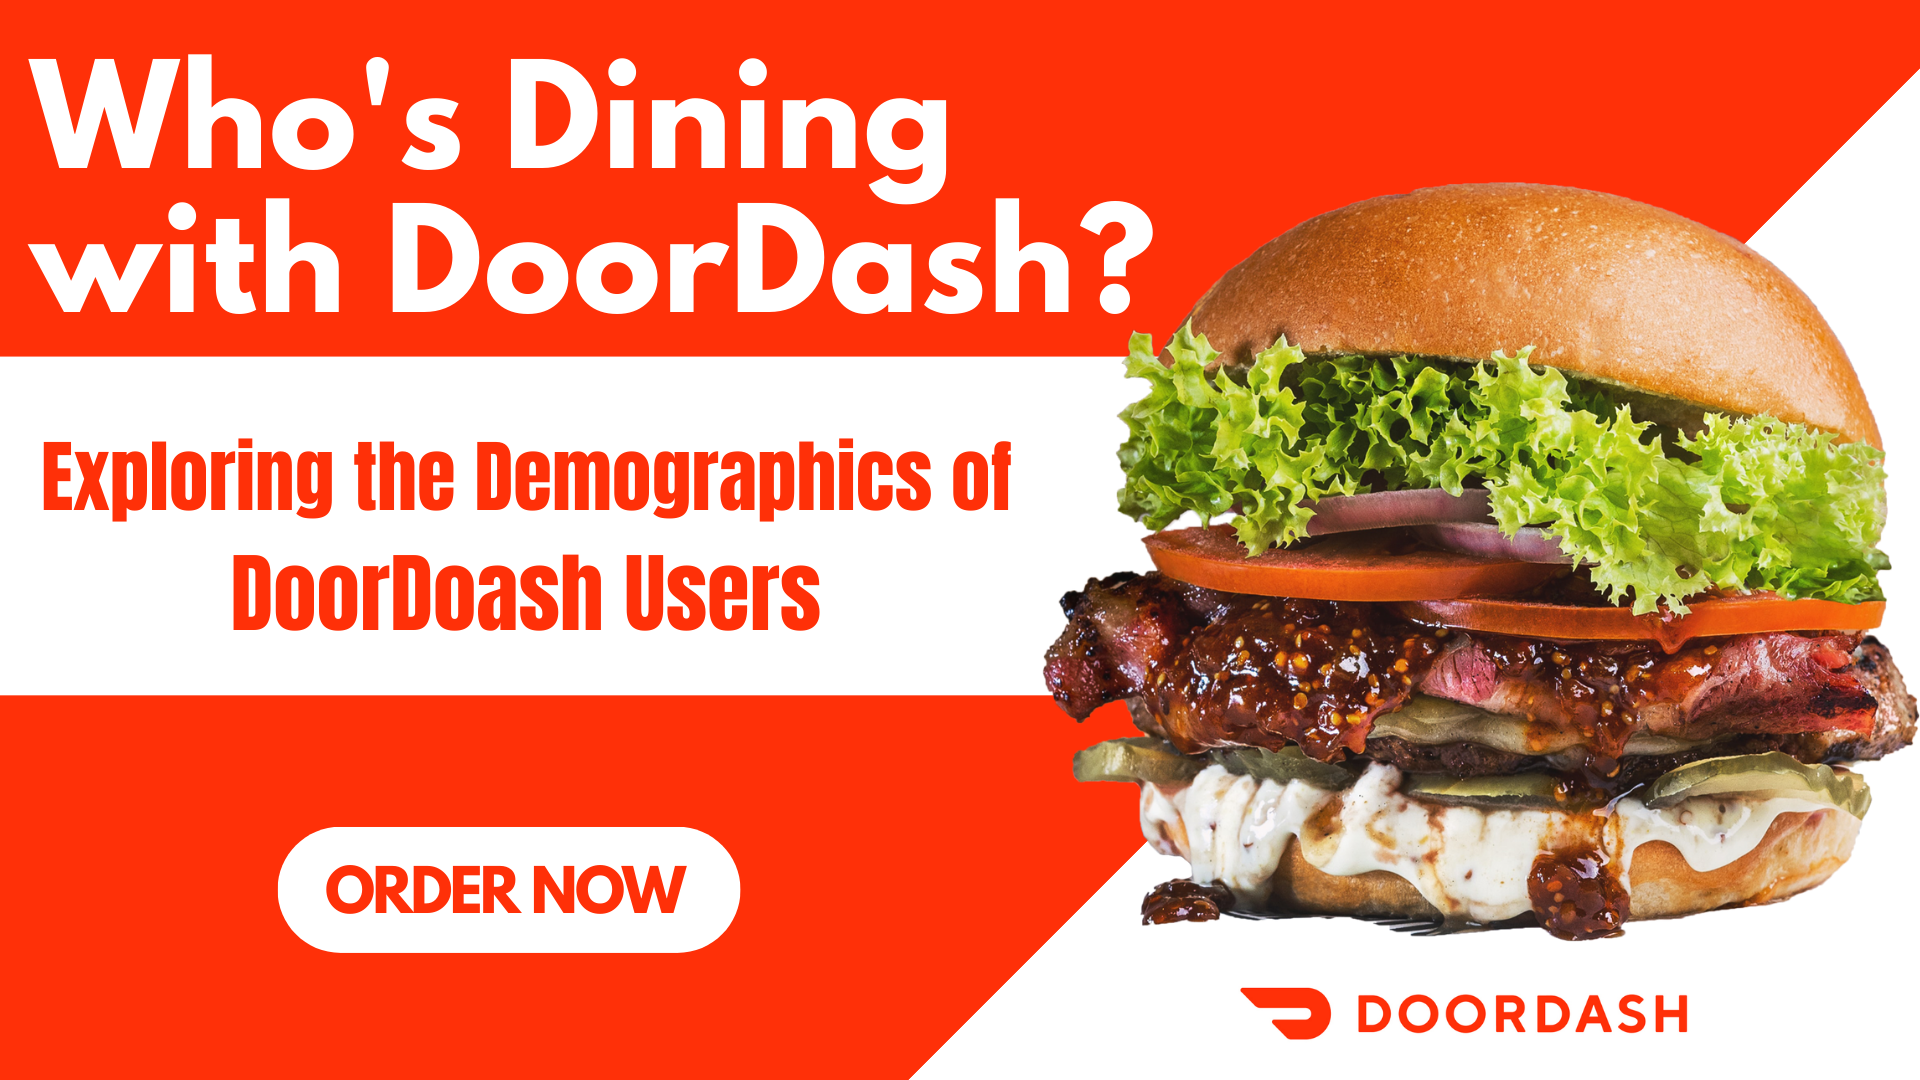
DoorDash Marketing Analysis

In the fast-paced world of food delivery services, DoorDash has emerged as a leader, transforming how we satisfy our cravings. Intrigued by its success, I embarked on a marketing analytics project to uncover DoorDash’s customer dynamics and demographic insights. Leveraging a real-world dataset from iFood, akin to DoorDash in Brazil, I securely stored it on my OneDrive cloud. With Excel’s formidable functions, dynamic graphs, and pivot tables, I immersed myself in the comprehensive dataset, extracting vital demographic attributes and gaining profound insights into DoorDash’s customer base.By harnessing Excel’s analytical prowess, I aimed to provide indispensable insights for strategic decision-making and marketing optimization, ultimately enhancing DoorDash’s competitive edge. These insights, transformed into compelling visuals, were further highlighted and communicated effectively through Microsoft PowerPoint, ensuring that the findings remained impactful and actionable in the dynamic food delivery landscape.
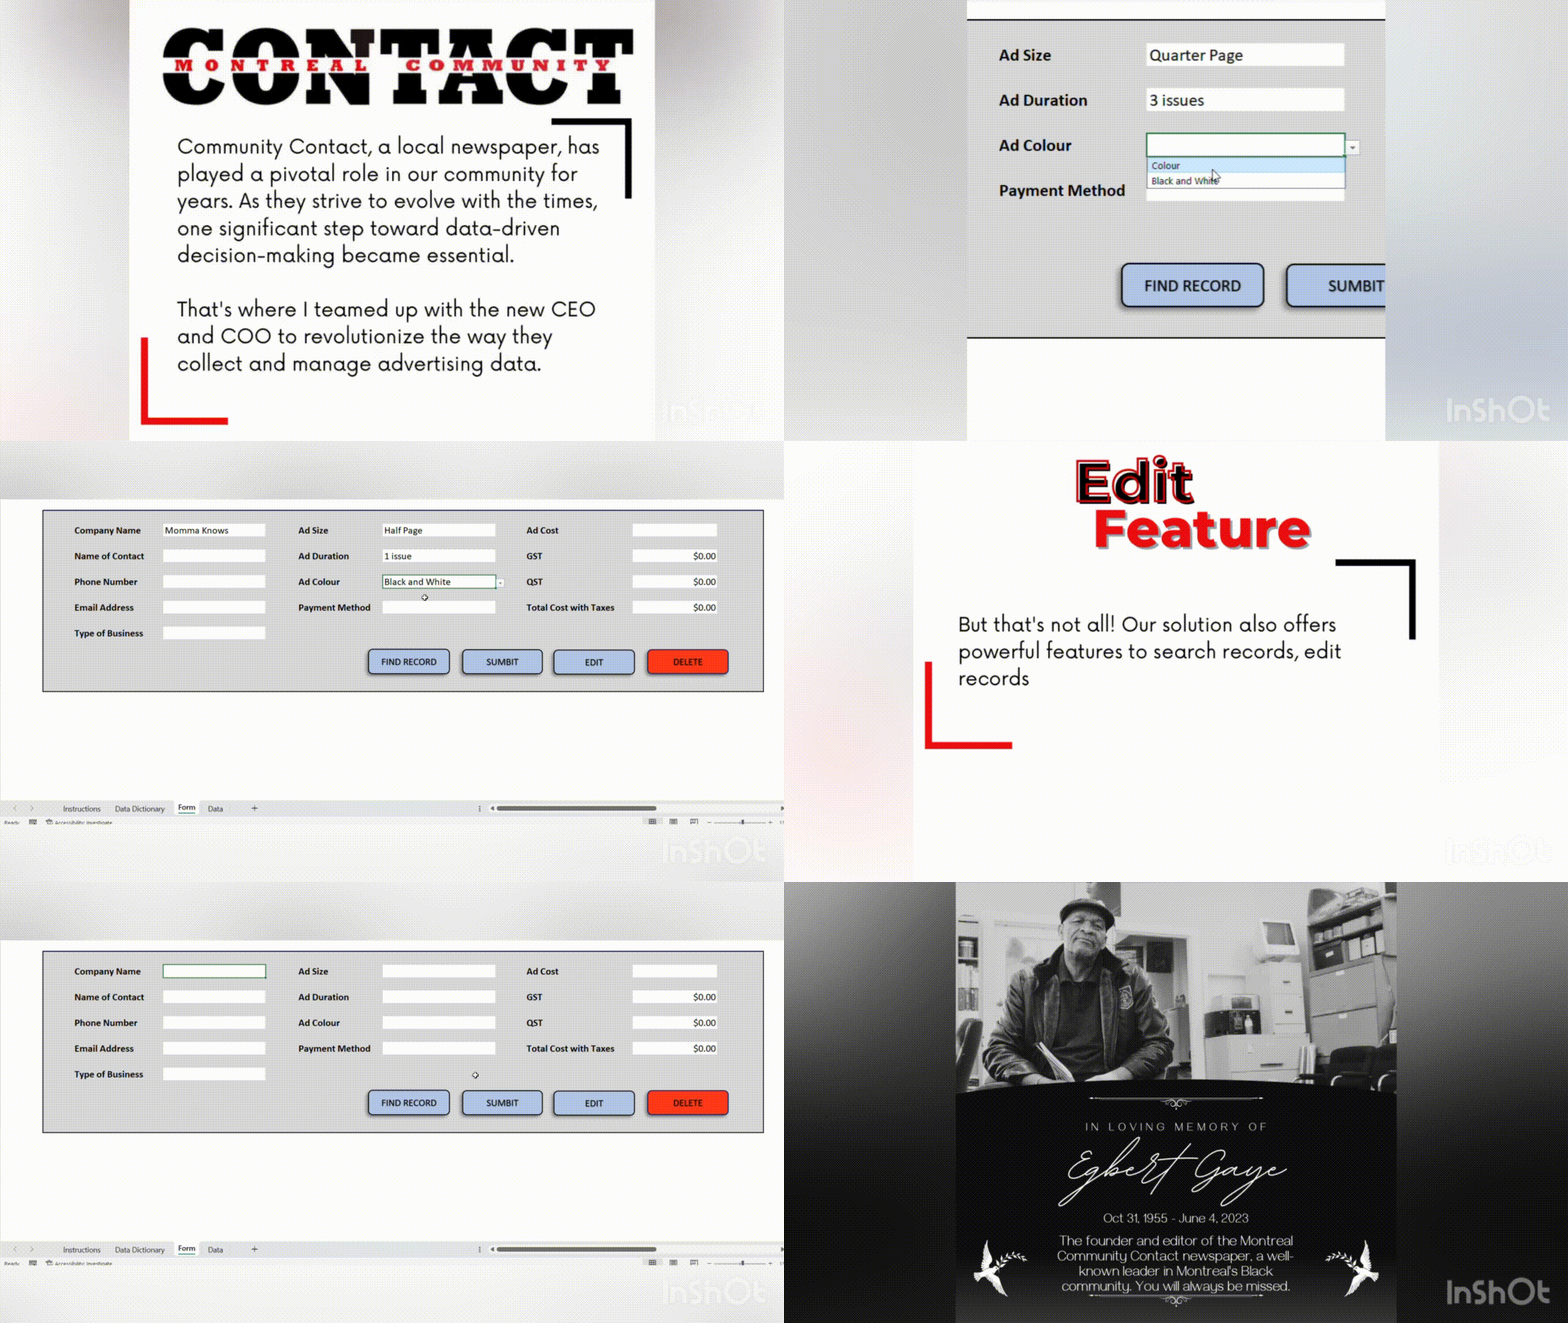
Community Contact User-Friendly Data Automation Form

My very first job was with Community Contact, where I started my career as a young writer, crafting articles for the community. It’s incredible how life comes full circle.
Now, I’ve had the incredible opportunity to collaborate with them again, this time as a data analyst, and assist in their transformation to adapt to the modern era.
After discussing their data needs with the new CEO and COO of Community Contact Newspaper, I offered to help build this form, taking into consideration their specific requirements and the information they would like to record. I built this form using Microsoft Office, primarily utilizing VBA, macros, Excel formulas, and conditional formatting. It’s a simple and user-friendly form that enables them to efficiently record and generate data, something they couldn’t do effectively before.
This user-friendly form is just the beginning of a positive direction for them to make data-driven decisions.
Tableau Massachusetts Education Dashboard

“A good education is the foundation for a better future.” - U.S. Senator Elizabeth Warren of Massachusetts
In this Tableau project, I bring this quote to life by diving into the Massachusetts education system. Through captivating data analysis and visualization, I uncover insights on top-performing elementary math schools, struggling high schools, and the impact of class size on college attendance. The journey begins with sourcing data from the Massachusetts Department of Education’s official website for 2017, utilizing Excel for cleaning, Tableau for visualization, and PowerPoint to spotlight the transformative power of education.
Dominica’s Financial Journey Funds, Debts, and Resilience

This SQL project is a personal exploration of Dominica’s relationship with the World Bank using live data. With a strong desire to visit the island, I feel a special connection knowing that my dad’s mother is originally from Dominica. The data, sourced directly from the World Bank website and stored in the cloud, underwent SQL queries using CSVFiddle.io. This research allowed me to delve deeper into my roots, making the connection to my dad’s native heritage even more profound. Throughout the project, I delved into the number of transactions, the total amount of money received, the funds repaid, the current debt owed, and identified the most expensive projects, uncovering their focus and significance. Using PowerPoint, I highlighted the key findings and dedicated this project to my father, cherishing his memory in this endeavor.
Call Center Dashboard

During my virtual internship at PwC Switzerland, I embraced an exciting challenge from telecom company PayNow. They needed a dashboard to monitor agents’ performance and gain insights into customer behavior. The dashboard focused on crucial subtopics, including answered/unanswered calls, calls per hour/month, speed to answer calls, resolved/unsolved call numbers, topics discussed in calls, and average satisfaction rating. I meticulously processed and cleaned their data with Excel, DAX and Power Query, ensuring accuracy for dashboard development. Leveraging Power BI, I crafted a comprehensive dashboard revealing long-term trends, enabling data-driven decisions to enhance efficiency and profitability. This project honed my data processing and visualization skills, delivering valuable insights to a real-world client.
Data Don’t Lie: An In-Depth Analysis of Toronto Raptors’ Performance 2021-2022 Season

Just like in basketball, where data don’t lie, this project takes you behind the scenes of the Toronto Raptors’ thrilling journey throughout the 2021-2022 NBA season. With Excel as my ally, I meticulously refined and prepared the data for unwavering accuracy, securely storing it in the cloud. The enchanting touch of Tableau then transformed these numbers into visual narratives that captivate and inform. Unearth the hidden strategies of playmaking brilliance, harness the potential of shooting statistics, explore the intricacies of rebounding dynamics, and unlock the secrets of shot-blocking prowess. Beyond basketball, this is a journey into the realm of data-driven insights that can elevate how we understand and improve performance. Highlighting these findings, I used PowerPoint to provide a clear and compelling perspective on the team’s journey.
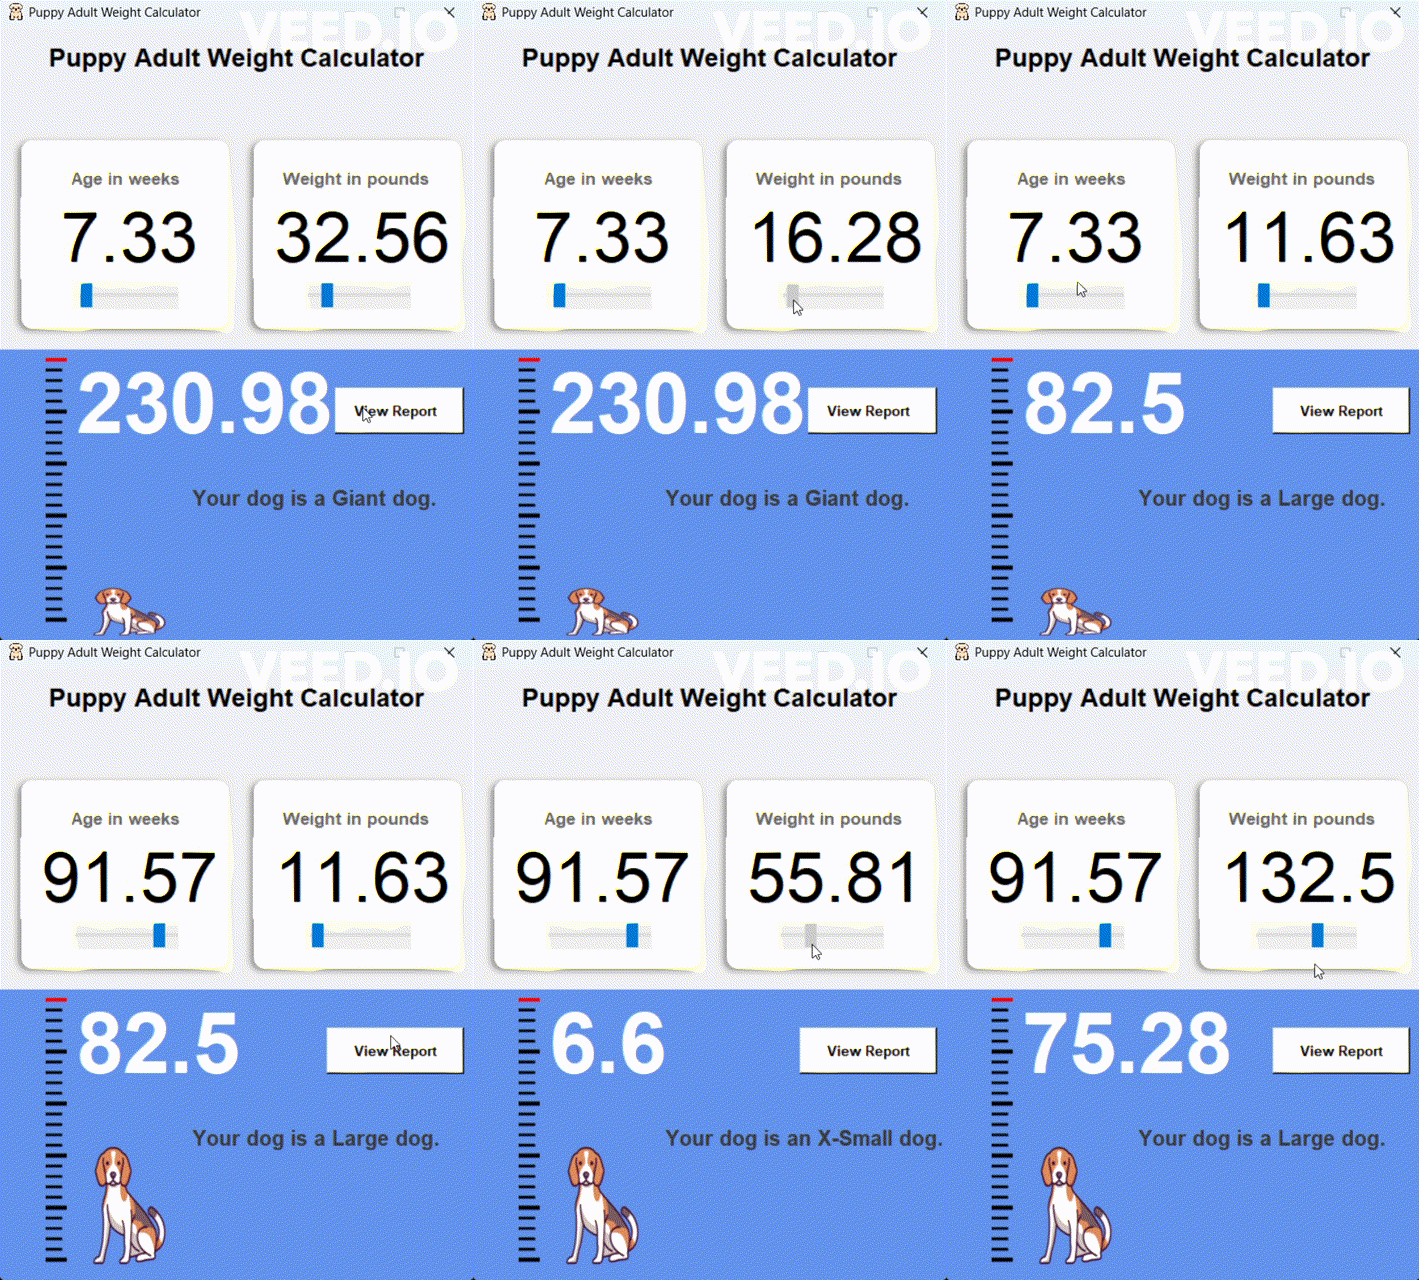
Puppy Adult Weight Calculator

As a proud new owner of a beagle puppy, I took on a Python project to ensure his healthy growth. With concerns about his weight, I developed a calculator to predict his adult weight based on his current weight and age. Using my programming skills, I created a command-line program that employed a fundamental formula for this purpose. This project not only helped me monitor my puppy’s growth but also allowed me to apply programming to a real-life situation. I take pride in having built a practical tool that nurtures my beloved beagle’s well-being and helps me make informed decisions about his health and development.
More projects
- HR Dashboard Analysis for a Four-Year Company
- Office Supplies Store Python Report
- What’s Age Gotta Do with It? In HR Data, it’s More Than We Know..
- Grade 8 English Class Excel Dashboard
- Customer Retention Power BI Dashboard
- Sims Project: Rating and Evolution (Tableau)
- Prosper Loan (Python Project)
- Chipotle sales using Python
- Airbnb dataframe listing using pandas
- AirbnB data and visualization using NumPy
- Metals in Focus: Analyzing Iron Concentration Patterns in Mining (Python Project)
- I’m sorry to tell you, but here’s the data: Insights into Hospital Practices (MySQL Project)
- Danny’s Diner (SQL Case study)
- LeWagon Workshop: Predicting stocks with Python
💬 Contact Me 📩
Looking to collaborate on an exciting project or discuss data-related opportunities? I'm all ears! 🎧 As a data analyst with a passion for transforming complex information into actionable insights, I thrive on turning raw data into compelling stories. 📊
📧 Email Me | 💼 LinkedIn | 🌐 Website